January 28th 2022
Diamond Cut Score: How It Works
By Devin Jones
Cut Score is StoneAlgo's measurement of how perfectly cut a round diamond is in order to maximize light performance (fire, brilliance, and scintillation).
How does StoneAlgo's Cut Score work?
StoneAlgo's diamond cut score predicts how sparkly a round cut diamond is on a simple scale from 1 - 10. This score can help you identify the most exceptionally cut diamonds and avoid duds. The cut score takes a round diamond's depth %, table %, girdle thickness, pavilion angle, crown angle, and other dimensions to determine how perfectly the diamond will reflect light (and sparkle). You can check the cut score of any GIA or IGI certified round diamond using our diamond check tool.
🛡️ Check your diamond 💎 Search 2M+ diamonds
Cut Scores: 1-10 Explained
Here's a layman's approach to understanding our cut score grades:
- 10's are totally perfect (they don't exist - they would require extremely precise measurements that we can't get from a GIA certificate)
- 9's are the very best Excellent cut diamonds
- 8's are above average for Excellent cut diamonds
- 7's are average for Excellent cut diamonds
- 6's are below average for Excellent cut diamonds, and above average for Very Good cut diamonds
- 5's are average for Very Good cut diamonds
- 4's are below average for Very Good cut diamonds, and above average for Good cut diamonds
- 3's are average for Good cut diamonds
- 2's are below average for Good cut diamonds, and above average for Fair cut diamonds
- 1's are average Fair cut diamonds
- 0's are below average Fair cut diamonds
If you don't have access to our cut score, you can follow this simple rule of thumb: a perfectly cut diamond will have a tight, circular center positioned in between dark arrows that point out toward the edge of the diamond.
See the below GIF showing a 6.0 cut score diamond with a very wide center versus a 9.6 cut score diamond with a tight circular center and more visible arrows. Keep in mind that your ability to see these arrows depends on the image you view online (angles, lighting, etc. all factor in).
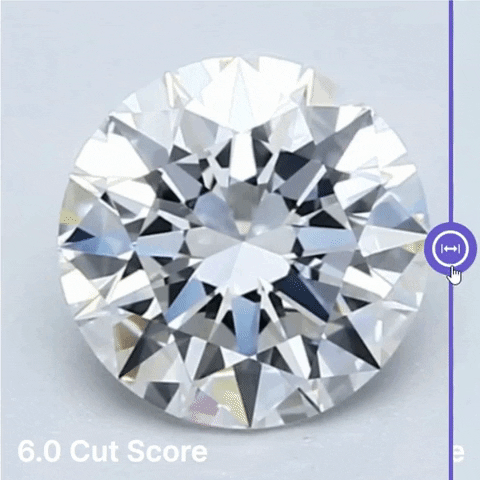
A perfectly cut diamond will have a tight, circular center positioned in between dark arrows that point out toward the edge of the diamond.
Continue reading for more details on why we created the diamond cut score, the limitations of GIA and AGS cut grades, and how cut quality effects diamond pricing (or doesn't in certain situations).
GIA vs. AGS Cut Grades
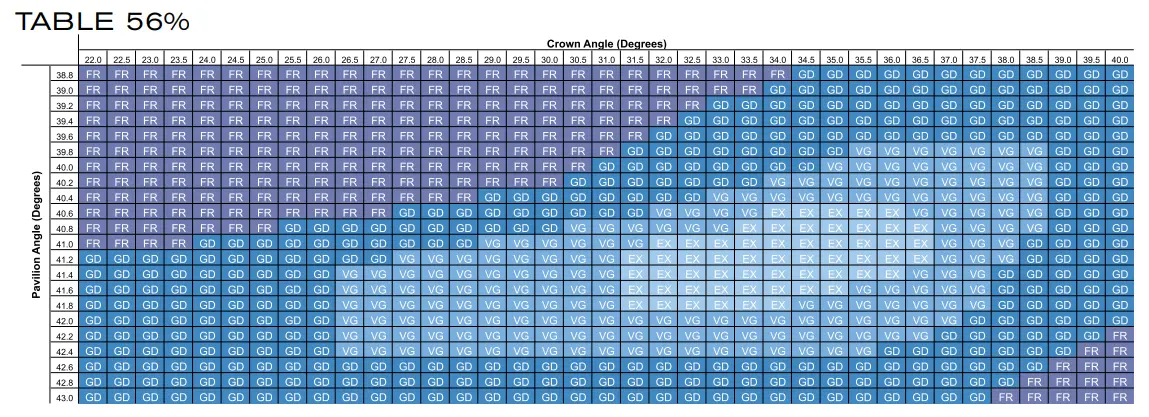
The GIA and AGS have published their own static tables showing the measurements that qualify a round cut diamond as Excellent or Ideal cut. You can explore the GIA cut grade tables and AGS cut guidelines for more details on these ranges. What the tables show are the combinations of table %, pavilion angle, and crown angle that produce and excellent/ideal, very good, or good cut diamond. These angles move together to completement one another in different ways. For example, a higher pavilion angle is complemented by a lower crown angle and vice versa.
Here's an example of the GIA's cut grade estimations for round diamonds with 56% tables and a variety of crown angles (top x-axis) and pavilion angles (left y-axis). The GIA assumes a 3.0% girdle thickness. Depth % can be solved mathematically based on all of this other info, so the GIA doesn't mention depth % on these charts.
At the end of the day, the GIA, AGS, and other rating agencies lump diamonds into rigid categories like Ideal or Excellent, Very Good, Good, Fair, and Poor. But why should we think there is a significant difference between the worst Excellent cut and the best Very Good cut diamond when there is hardly a difference at all?
The GIA announced the acquisition of AGS in 2022. The AGS lab will be rolled into the GIA in 2023.
As you can see in the cut grade estimation table above, a single degree difference in pavilion angle could move an Excellent cut diamond across the boundary into Very Good territory. On the flip side, why should we think the worst Excellent cut is the same as the very best Excellent cut? If the worst Excellent cut is nearly a Very Good cut, while the best Excellent cut is far from having those credentials, wouldn’t it make sense to prefer the better Excellent cut?
Furthermore, the AGS & GIA don’t agree on the same specifications for their top grades because these grading systems are man made constructs. The existing grading systems which simplify cut quality specifications into a single word were simply not good enough for nit picky diamond buyers like me. I needed something a little more refined, so I started doing some research.
The Most Important Angles for Diamond Cut Quality
There is no SINGLE diamond cut that is perfect. There are numerous “local maximums” on the diamond cut quality scale, and they depend on a variety of angles and measurements that balance each other out. The main dimensions required for measuring cut quality are table %, pavilion angle, crown angle, girdle thickness, and depth % (which can be solved for as a dependent variable). Most cut quality grading charts do not include girdle thickness, a major flaw since this directly affects the ideal pavilion angle required to return light back out through the top of a diamond.
Diamond Cut Charts
AGS Ideal cut diamonds (AGS 0 cut grade) have an even more stringent set of parameters than GIA Excellent cut diamonds. They also differ slightly, where some AGS 0 diamonds will not be GIA Excellent and vice versa. One of our first steps in analyzing the interplay between different measurements and angles was to go through every grid produced by the AGS to get a deeper understanding of how they interpreted cut quality based on two dimensional information.
The AGS has produced tons of tables that create different heat maps based on Table % that show the ideal crown and pavilion angles for their different ratings of AGS 0 – 10 (AGS 0 is the best), while assuming that the girdle thickness is fixed at 3.5%. What you can see below is that the sweet spot for crown and pavilion angles (the red zone representing AGS 0) shift and shrink considerably when the table changes from 57% to 60%. You can see all of these tables on the AGS’s website here. Our cut quality scoring system would need to naturally adjust to different parameters.


Below is a simple interpretation of how the ideal crown angle and pavilion angle balance each other out at different table percentages.

Old Mathematical Models
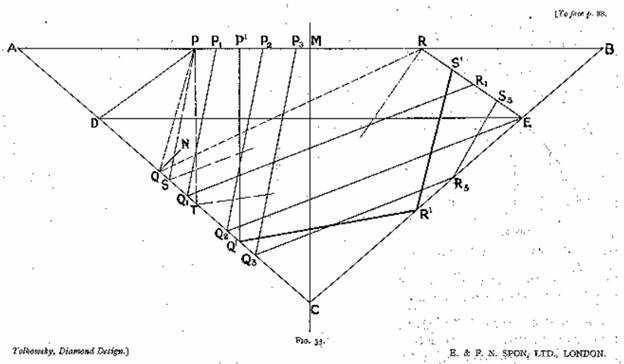
The AGS has done a ton of great work, but we needed to come up with our own model and find a way to make something more robust – something that could handle different girdle thicknesses and score over a million diamonds to determine which were the best and worst of the GIA Excellent/AGS Ideal cut diamonds. We found our foothold in an old book on the mathematics of diamond design from 1919 by Marcel Tolkowsky. Tolkowsky’s words, written nearly 100 years ago, were music to our ears.
It is a remarkable fact that, although the art of cutting a diamond has been known for more than two thousand years, it is entirely empirical, and that, though many keen contemporary minds have been directed upon the diamond, and the list of books written on that subject increases rapidly, yet nowhere can one find any mathematical work determining the best shape for that gem. The present volume's chief aim is the calculation of that shape.
Tolkowsky goes on to describe a detailed study of the optics of light performance and how this relates to the angles and overall geometry of a gem stone. He describes the importance of reflection (light bouncing off of the diamond’s exterior), refraction (light that enters the diamond and is bounced back out of the stone), and dispersion (white light breaking into a rainbow of colors aka “fire”) – all the while remaining mathematically rigorous in his approach. In the end he creates a framework that we could leverage in our own mathematical modeling and for which we are deeply grateful.
StoneAlgo Cut Quality Score
After studying a long list of technical and non-technical resources we were able to work out our own formula that included all of the relevant angles and measurements (including girdle thickness) to determine a fair approximation of a diamond’s cut quality. Our model is calibrated with a maximum score of 10 points (representing “perfect” diamonds) and detracts points based on how far a diamond’s geometry falls from its nearest “perfect” cousin.
There are many ideal shapes for a round cut diamond, as the interplay between different table percentages, pavilion angles, girdles, and crown angles may balance each other out to produce excellent light performance for various combinations of these measures. Our cut quality grading system recognizes this fact and is incredibly robust at handling it. We believe it is the best 2D cut quality analysis tool on the market today – allowing for a quick interpretation of cut quality and light performance without the requirement of 3D light performance imaging.
After scoring over 1.1 million diamonds (as of this writing in November 2018) we ranked all of the diamonds based on their cut score and determined their percentile rank. The top 1% (99th percentile) of diamonds receive cut scores of 9.7 or higher, the top 10% are 9.4 or higher, top 25% are 9.0 or higher, and the top 50% are 8.4 or higher.
We recommend searching for diamonds in the top 50% of all GIA Excellent cut diamonds because they don’t command a significant premium in the market but offer better light performance. Put slightly differently, as I interpreted this fact when searching for my own diamond, it’s like getting a free upgrade.

Diamond Prices and Cut Quality Scores
It is fair to say that given the choice between the best GIA Excellent cut diamond and the worst GIA Excellent cut diamond, we would all prefer the best one (all else being equal). Since this is an opinion that most rational buyers would agree on, it in turn makes sense that we should place a higher value on the best cut diamond than we do on the worst cut diamond.
However, the market does not always recognize this difference and this leads to buying opportunities for the best cut quality diamonds. But sometimes the market does discount diamonds of lower cut quality, even when they are graded as GIA excellent cut. In these situations it may make sense to purchase a lower cut quality diamond as long as it still looks appealing to the eye. The lowest GIA Excellent cut quality specifications are still very good, and these diamonds should still look great to the human eye. It all comes down to what you as a buyer are looking for, and the price that the diamond commands.
A Final Note on Finding Diamonds
Like all mathematical models that seek to replicate physical objects based on limited data, the StoneAlgo Cut Quality Score is not an exact representation of a diamond's physical beauty. The data we use is two dimensional, and a diamond is a 3D object. We are forced to assume that the angles and widths are consistent in 360 degrees around the diamond, but this is often not the case.
However, the StoneAlgo model is outstanding at what it does and should correlate highly with light performance (we’ve studied light performance imaging for a large population of diamonds to confirm this). The StoneAlgo Cut Quality Score is a tool, but it is not a direct replacement for your own eyes. A diamond buyer should never purchase a stone sight unseen, and this is why we exclusively show diamonds with real HD images (and light performance images when available) on StoneAlgo. We hope you find this info useful and that it gives you another powerful weapon in your search for the best diamond.